Welcome to the Part 3 of Supervised Machine Learning post. I hope you have gone through the previous posts on Machine Learning and Supervised Learning Part 1 and Part 2.
If no, kindly go through those before starting from here. In this post we are going to see about the various algorithms of supervised machine learning with examples and the applications of Classification and Regression in next post.
In the last post we have seen about the two types of Supervised Learning which are Classification and Regression and we have also discussed examples for each of the type. Now let us go through the various Supervised Learning Algorithms and see whether it comes under Classification or Regression.
Supervised Learning Algorithms
There are many types of algorithms which are used in Supervised ML. All these algorithms come under either Classification or Regression. Let us have a look at the algorithms.
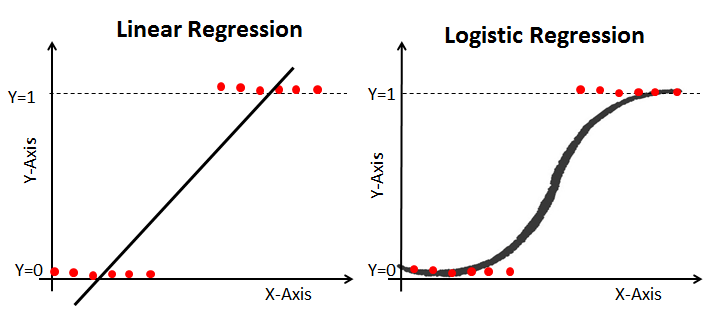
Linear Regression:
Linear Regression algorithms are used to predict the linear relationship between the 2 variables. Those two variables are Dependent variable (Outcome variable) and Independent variable (Predictors). There will be many number of independent variables but only one dependent variable.
When an new data is passed to this algorithm it calculates and maps the input to a continuous value for the output. As the name suggests, this is a linear model. The projection for this model is Y= ax+b.
If the dependent variable is Categorical then it comes under Classification. Similarly if the dependent variable is Continuous then it comes under Regression.
So, in linear regression the dependent variable is Continuous in nature. Example – You can use linear regression to predict the house price from training data. The independent variables will be locality, size of a house, etc. The dependent variable is House prices.
Logistics Regression:
Logistic regression method used to estimate discrete values of the data based on given a set of independent variables. It helps you to predicts the probability of occurrence of an event by mapping the unseen data to the logit function. . As it predicts the probability, its output value lies between 0 and 1. It is shown as y = ln(P/(1-P)).
Here the dependent variable is categorical and independent variable is scale, categorical or combination of both. Though it is named as Logistic Regression it comes under Classification.
To prevent Overfitting, k fold cross validation is used in both Linear Regression and Logistic Regression. If you haven’t gone through cross validation post, please click here.
Example for logistic regression – Credit Card Fraud Detection. The dependent variable is Categorical which tells whether the customer is fraud or not which is the labeled data.There are many independent variables like date of the transaction, amount, place, type of purchase.
The classes in a classification problem need to be mapped to either 1 or 0 which in real-life translated to ‘Yes’ or ‘No’, ‘Rains’ or ‘Does Not Rain’ and so forth. The output will be either one of the classes and not a number as it was in Regression.
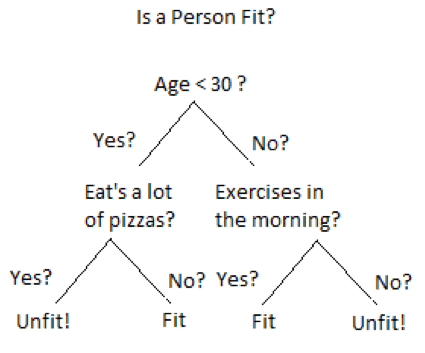
Decision Tree:
In decision tree, the dependent variable is Categorical hence it is used to solve Classification type problems.
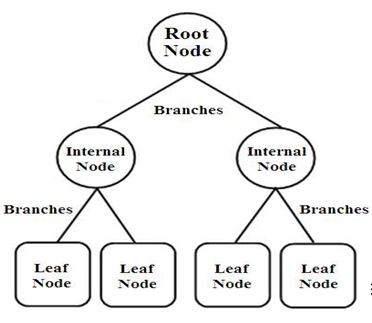
Decision tree is a flowchart in which each internal node represents a test on an attribute, each branch represents the outcome of the test and each leaf node represents a class label. They use the method of Information Gain and find out which feature of the dataset gives the best of information, make that as the root node and so on till they are able to classify each instance of the dataset.
KNN:
This algorithm helps to find in which class does a point belongs to using the distance. Here, k is the number of points to measure with. If you choose k=3, then the point which you want to classify will be measured with three of it’s nearest neighbors. The point gets classified in the class of which the majority of neighbors are part of. It is applicable to both Classification and Regression type problems.
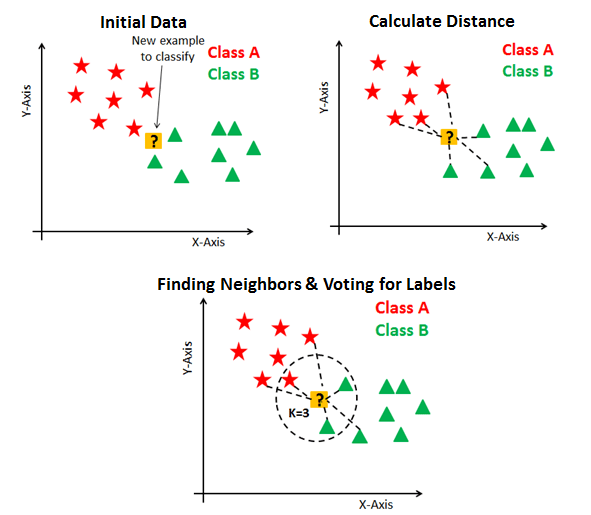
In the above example, the question mark is finally classified under Class B. Because in k=3, 2 of the three values are Class B. So it considers the majority of neighbor which is Class B. Similarly if we increase k=4, it will include the next nearest value and then make classification based on that. Mostly k value will be in odd value, to avoid the confusion if there is no majority.
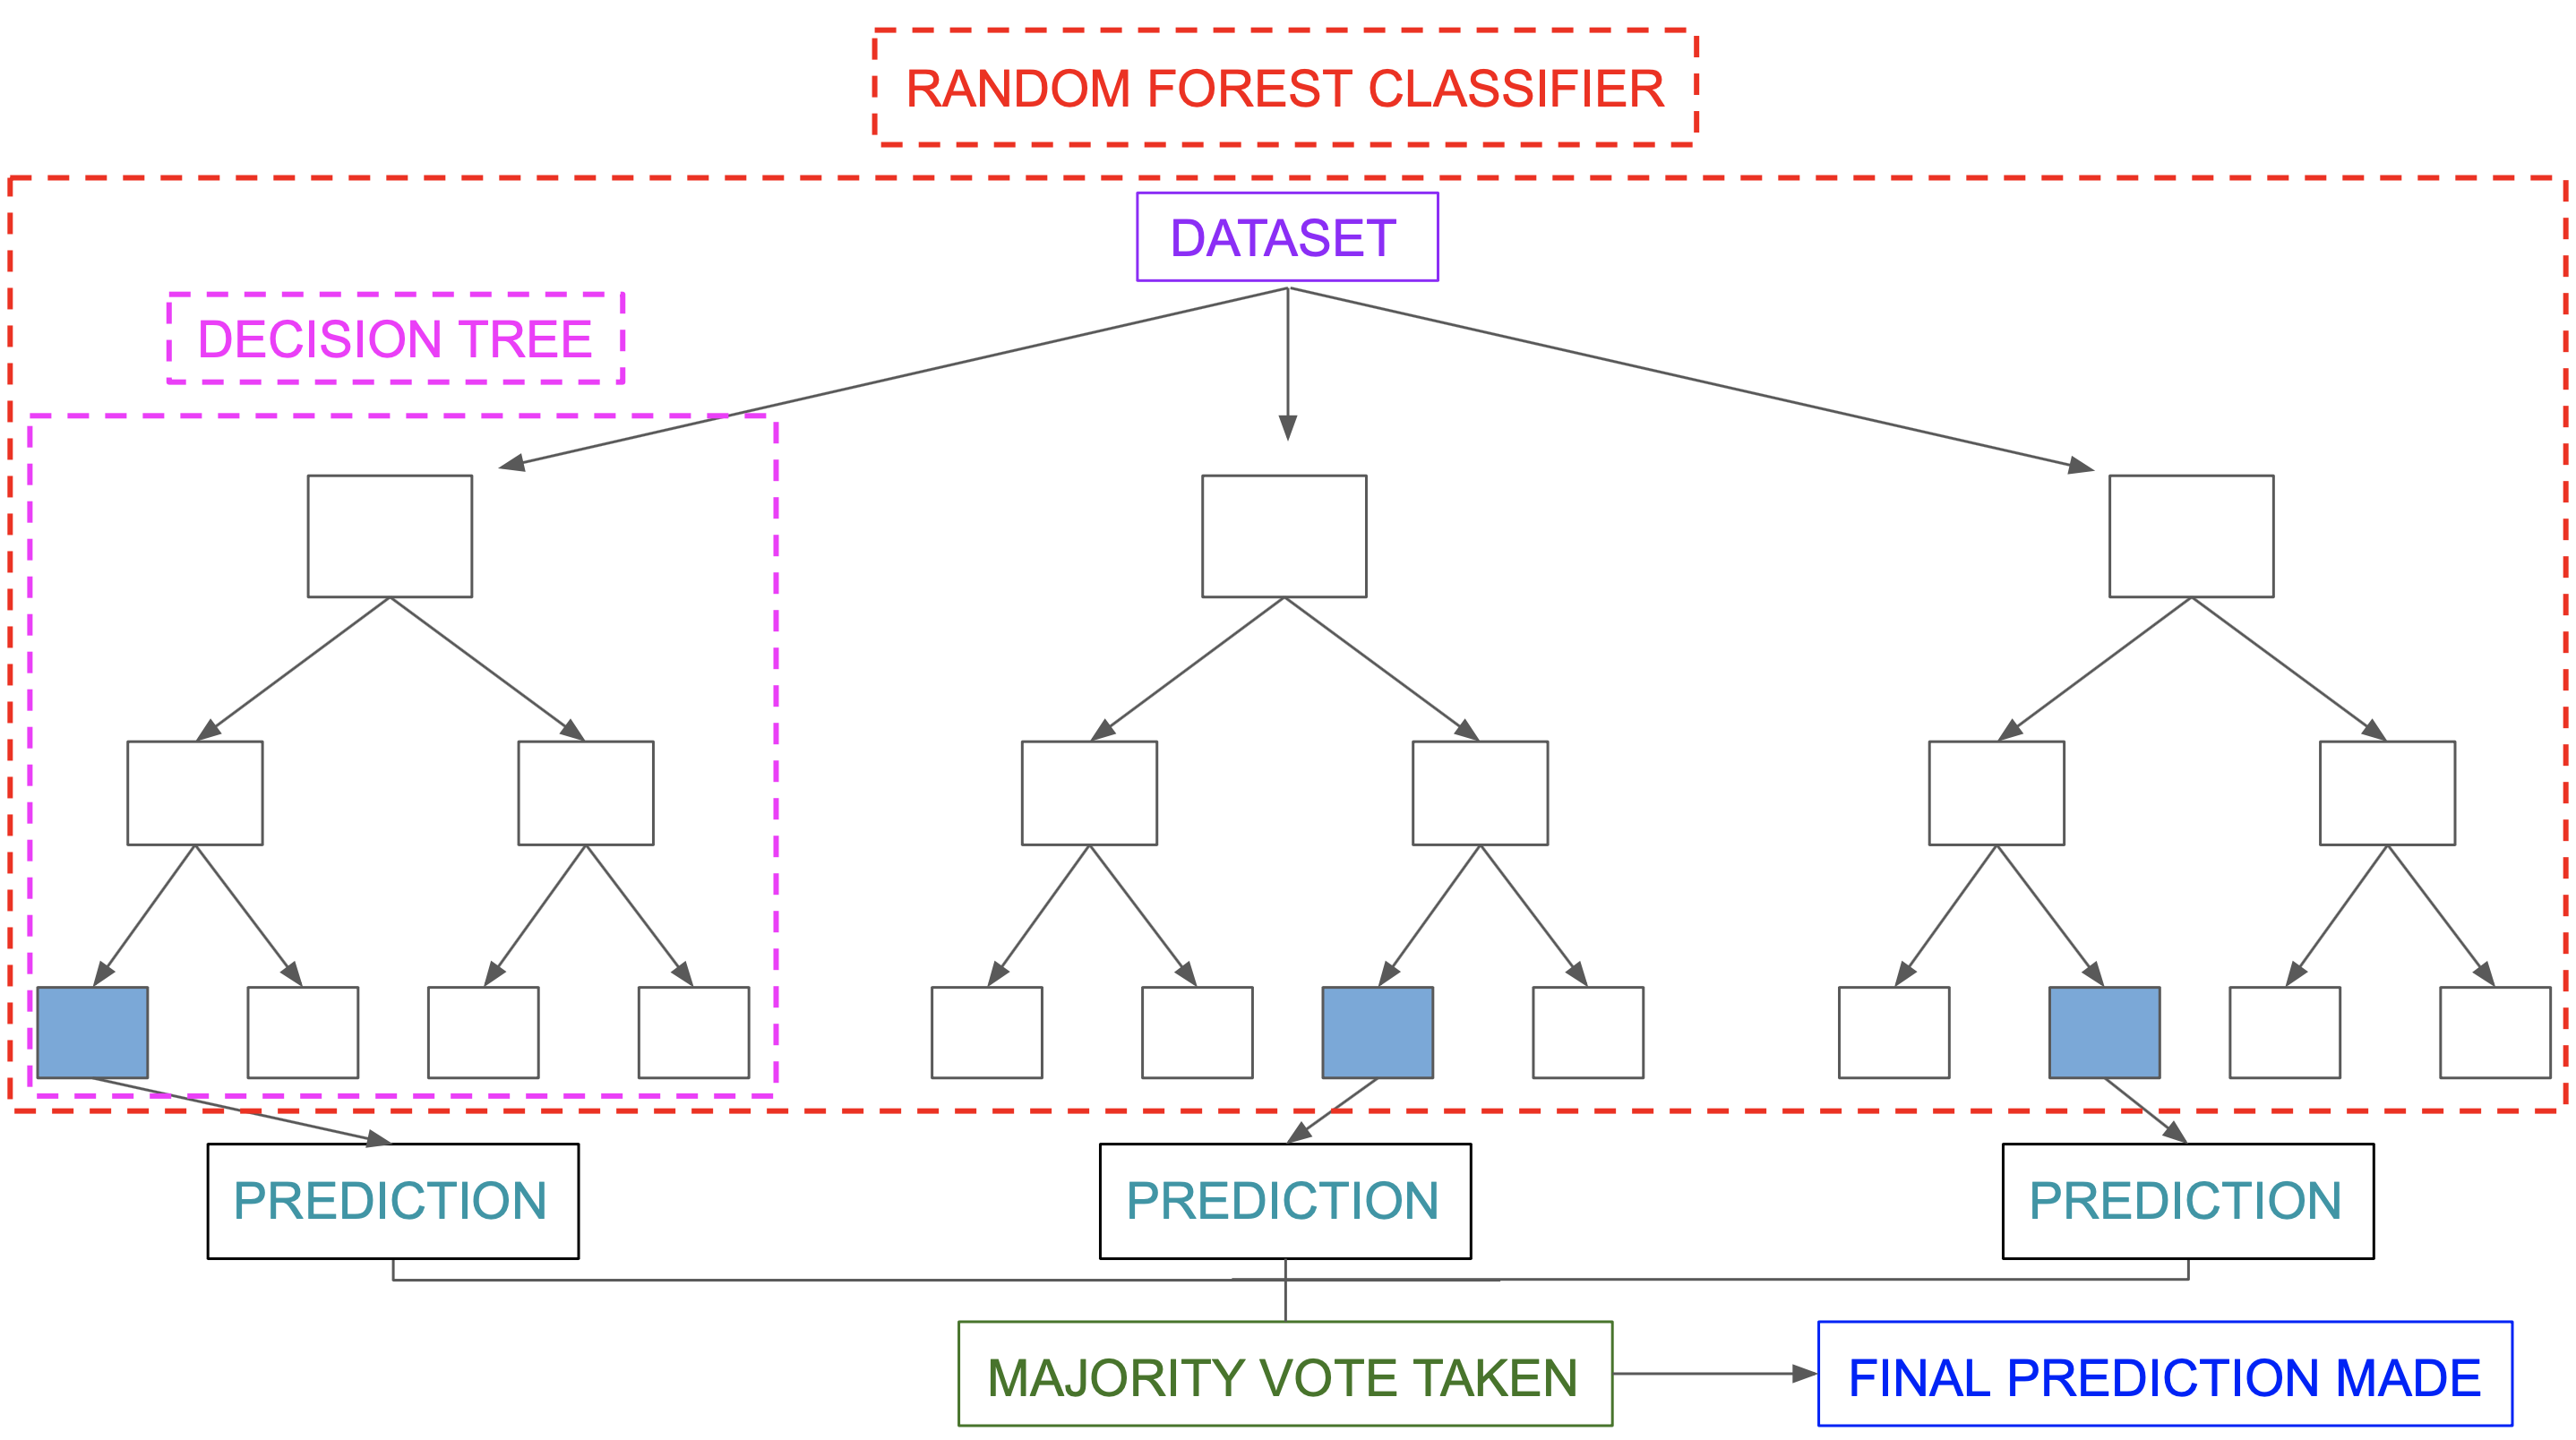
Random Forest:
Random forest is a collection of decision trees. So, for a situation, there are many possible outcomes that the random forest helps us to see. Random forests is an ensemble learning method for classification, regression which is operated by constructing a multitude of decision trees trained with the “bagging” method. The general idea of the bagging method is that a combination of learning models increases the overall result and accuracy.
This algorithm helps to find new patterns and possibilities for anything as the collection of trees helps in analyzing data in many ways. It has a more complex algorithm when compared to that of a decision tree. Hence, it would consume a lot more computational power and space. A random forest reduces the variance of a single decision tree leading to better predictions on new data.
SVM:
SVM stands for Support Vector Machines. It can be used for both Classification and Regression. They help to classify and analyze the data with the help of a hyperplane. It tries to find the separating hyperplane that maximizes the distance of the closest points to the margin. It performs classification by finding the hyperplane that maximizes the margin between 2 classes.
Hyper plane – It is a line that splits the space into 2 parts if it is 2 dimension.
Support vectors – The data points which are close to the hyperplane. There can be more support vectors for a single classification.
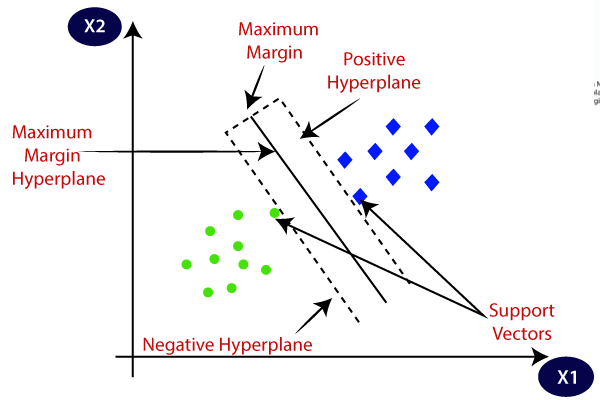
The aim is to find an optimal plane, which divides both data points. By maximizing the margin of the hyperplane, we increase the distance between the data points on either side. This is done up to the point where data points are distinct from each other.
In the next post we are going to see about the Applications, Advantages and Disadvantages of Supervised Machine Learning. Thanks for reading. Do read the further posts on Supervised Learning. Please feel free to connect with me if you have any doubts. Do follow, support, like and subscribe this blog.
Fact of the day:
The amount of technical information we are getting is doubling every 2 years. For students starting a 4-year technical or college degree, this means ½ of what they learn in their first year of study will be outdated by their 3rd year of study. Oops!
