Welcome to the Standard Deviation vs Variance post. I hope you have gone through all the previous posts on Machine Learning, Supervised Learning and Unsupervised Learning.
Standard Deviation:
Standard deviation is a measure of the amount of variation or dispersion of a set of values. It measures the Spread of a group of numbers from the mean.
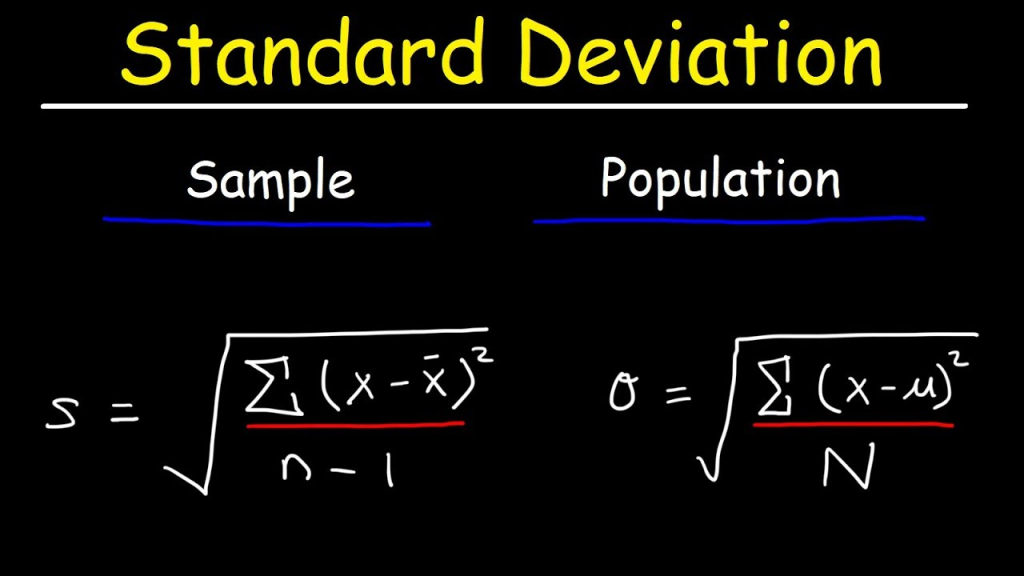
where,
N – size of population & n – size of sample, μ – population mean & x̅ – sample mean, x – each value of the data given
Example – 1) 15,15,15,14,16 2) 2,7,14,22,30
From the above given example, we find that the mean value of both 1) and 2) are same. But the values in 2) are clearly spread out. Therefore 2) has high Standard deviation compared to the 1). So, if a set has low Standard deviation, then the values are not spread too much or in other words most of the values are closer to the mean.
Variance:
Measures the degree to which each data points differ from the mean. It measures how far a set of numbers are spread out from their average value.
Variance is the square of Standard Deviation.
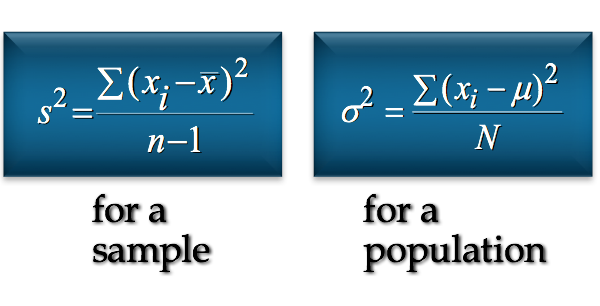
where,
N – size of population & n – size of sample, μ – population mean & x̅ – sample mean, x – each value of the data given
S.D vs Variance:
S.D —> Used to determine how spread out numbers are in a data set.
Variance —> Gives an Actual value of how much the members in a data set vary from the mean.
